We report here an experiment to draw a 3D surface of the power received by PB8 pointing a geostationary satellite. An estimation of the offset between the maximum of the directivity diagram and the position of the satellite (using trajectory prediction with our ephemeris model)
The protocol is a follows:
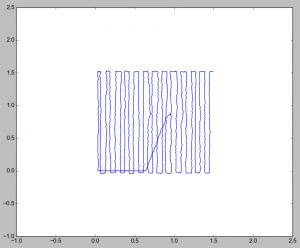
- PB8 will follow a systematic path to cover a surface (1.5°x1.5°). The center of the surface is the estimated position (ephemeris) of the observed satellite (IS-905). EL moves continuously (up/dow) with AZ constant. Different legs are made possible shifting AZ by 0.060°.
- The received power signal is measured along the path (F=4.117GHz, RHCP, bandwith 300KHz, 10Hz signal filtering). Approximatively 2,500 points are collected.
- A 3D interpolated surface (cubic splines) is built using these 3 dimensional values. Then we only keep a 2D projection of the surface.
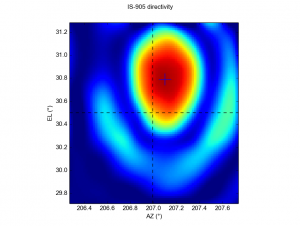
- A cut at -3dB under the maximum is done on the surface. The spatial barycenter of this cut defines the offset of the received power diagram and the true position of the satellite.
The following picture shows the trajectory of PB8 during the experiment:
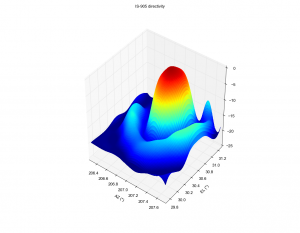
 Next picture is a 3D surface of the received power pointing IS-905:
 A second lobe can be easily seen of the previous picture, we project the surface on the AZ-EL plane:

